By: David Brown, VP of Government Affairs
What’s Hot and What’s Not in the Whitewater Rafting World
Revealing trends, which will determine the future of whitewater rafting in many areas, can be found by tracking use data for commercial customers visiting rivers around the U.S. Since 1990 America Outdoors Association has been compiling use data for the same set of guided whitewater rafting rivers. Currently, we are compiling data on 41 rivers[1] thanks in part to efforts of Joe Greiner in Colorado who keeps annual counts of commercial rafting visits in that state. Data from the remainder of the rivers on the list are compiled by David Brown from agency reports with the help of outfitters in those areas.
We know many important rivers are not included in the list, in part because the data has simply not been available on a reliable basis. We will expand the list if that data is made available on a regular basis.
In this article the most popular rafting venues are revealed along with factors that are contributing to their growth or decline.
Overall guided rafting visitation has increased by 36% from 837,499 visits to 1,529,909 visits on the rivers within our sample since we began keeping data in 1990. The peak year was in 2010 with 1,585,063 visits for our sample of 41 rivers Some of the increase since 1995 is attributable to new rivers coming online after relicensing of hydroelectric dams or other arrangements to provide commercially viable flows. New whitewater venues in our data since 1995 include the Pigeon and Upper Ocoee in Tennessee and the Chattahoochee in Columbus, GA. Recreational flows on the Lehigh were also been enhanced during that period.
The top ten rafting rivers in 2017 by popularity are:
Arkansas River
Ocoee River
Pigeon River
Nantahala River
Clear Creak
New River
Lehigh River
South Fork American
223,271
194,763
168,934
139,973
89,905
88,112
87,411
84,464
Visits for Commercial rafting have plateaued
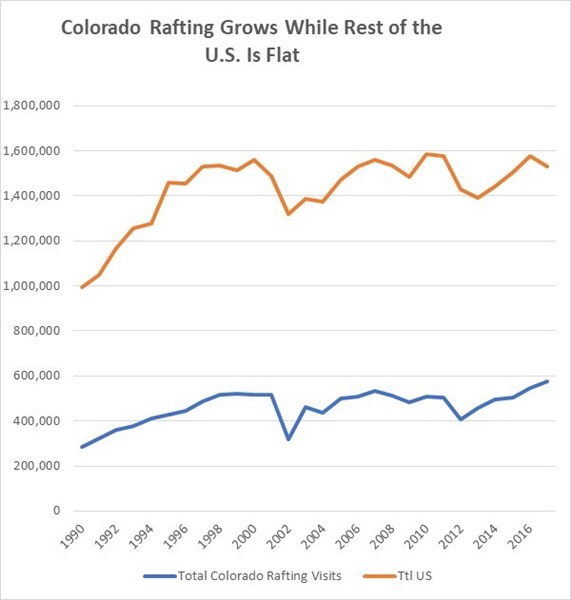
While there appears to be some continued growth in Colorado for guided raft trips, overall whitewater rafting visits nationwide have plateaued with steep declines in some mature markets and growth in newer markets where trips are affordable and lower risk.
The peak year for rafting visits was in 2010, later than some might think and largely due to the advent of new whitewater runs. Several other peaks in use have occurred along the way, including in 1995 when the “River Wild” hit the theaters. Visits to rivers in rural locations are in decline except for some of the marque multi-day rivers such as the Rogue in Oregon and Middle Fork of the Salmon in Idaho.
Areas where commercial rafting is still growing
Growth appears to be the strongest in areas near destination attractions or within short drives of metro areas. Softer adventures have stronger demand. In general, demand is stronger on Class II and III rivers than on Class IV and V rivers.
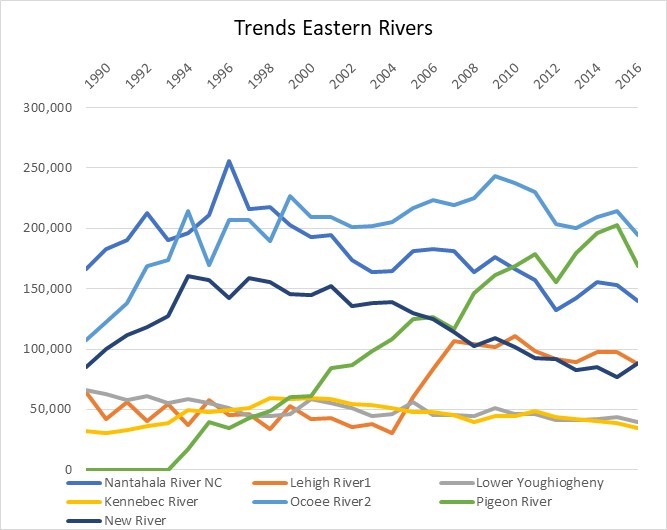
Use on the Class II Pigeon River in Tennessee near the nation’s most visited National Park, grew more than 1000% from 17,337 visits in 1995 to 202,874 visits in 2016. Use was down on the Pigeon in 2017 due to declines in area tourism because of the wildfires in Gatlinburg, TN. Clear Creek near Denver also saw growth, from a reported 650 visits in 1990 to 89,905 visits in 2017, a 13,000% increase.
Some of the most significant declines have occurred in mid-Atlantic states. Visits for guided raft trips on the Youghiogheny declined by 40% between 1990 and 2017. Visits to the New and Gauley River declined by 52% from 1995 to 2017.
States with most rafting visits in 2017
Colorado 574,383
Tennessee 400,000[2]
North Carolina 139,973[3]
Pennsylvania 126,764[4]
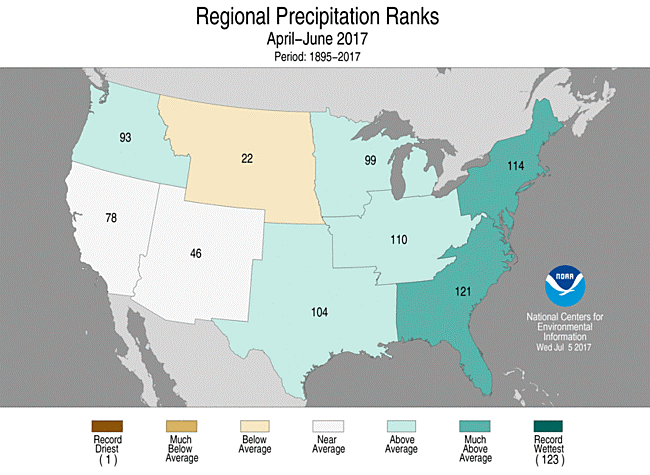
2017 saw an 8% decline in visitation on the major whitewater rafting rivers in the eastern U.S. Much higher than average precipitation and high-water levels in the spring and early summer of 2017 led to much of the decline.
[2] The Ocoee and Pigeon rivers saw a total of 363,697 visits in 2017. The Watauga River and Nolichucky also contribute addition visits but those counts are not available. An estimate of 40,000 additional visits for those rivers is added to the total. The Hiwassee River also see a significant number of visits but that use is general not guided trips.
[3] The French Broad river count is not added to this total because the data is not available.
[4] The Lehigh data includes an estimate of use outside Lehigh Gorge State Park.
What factors are impacting demand?
As everyone knows, risk-taking baby boomers drove the growth of the whitewater rafting industry in the 1970’s and 1980’s and that market is aging out. The family market became more prominent in 1990’s. As baby boomers age out of the market, new entrants are not replacing them in some areas in sufficient numbers to sustain demand. This weakness puts pressure on pricing and profitability. The resulting downward spiral in the number of companies also results in a significant decline in the overall marketing reach of the industry in that area.
The importance of nearby destination attractions to fuel demand for rafting cannot be overstated. The Colorado is a major destination for tourism in the summer months. The resident population of Colorado in 2010 was just over 5 million compared to 12 million in Pennsylvania. The size of the 20 to 40 year-old market in Pennsylvania dwarfs that demographic in Colorado. But Colorado continues to see growth while rafting in Pennsylvania is in decline. The primary difference is the influx of tourists to the Colorado mountains, which is a premier destination for summer vacationers. With a large number of commercially viable streams and a flood of tourists to the mountains each year, no other state can compete with Colorado for the sheer volume of rafting visitors. Likewise, tourism to the Great Smoky Mountains National Park with its 8 million annual visits drove growth on the Pigeon River, which would be a minor player without that influx of visitors.
Many other factors are in play, such as the growth of artificial or modified whitewater venues in some locations, which have siphoned demand from nearby rivers. For example, the growth of the rafting venue in Columbus, Georgia has reduced numbers on the Ocoee River in Tennessee by a few percentage points. The Ocoee and Chattahoochee in Columbus share the Atlanta market. Likewise, the artificial whitewater venue at the National Whitewater Center in Charlotte, NC with its variety of adventure activities and entertainment, has competed significantly with natural rivers in North Carolina and Tennessee.
Many outfitters find the market to be much more risk averse now than 20 or 30 years ago, which explains the weakness in demand for higher class whitewater. Expansion of the school year in some states is shortening the summer travel season and negatively impacting demand for many attractions. July has replaced August as the most popular month for rafting on the Ocoee River. School starts the first week of August in Tennessee now, which marks the end of the high demand rafting season.
Fewer and fewer companies rely on only one activity, such as rafting, to sustain their business. Diversified recreational experiences combined with lodging, retail and entertainment provide a more reliable income stream and a longer season in today’s market. Still, unlike some recreational activities, such as bungee jumping, that proved to a flash in the pan, rafting has been resilient over the years in part because it provides a reasonable level of thrill and risk with powerful opportunities to have fun with family and friends.
Natural events such as fires, excess precipitation and drought also have short-term impacts. Rafting visits to eastern rivers were down 8% overall in 2017 when compared to 2016. Much higher than average precipitation and high water depressed demand in the spring and early summer, leaving on July and shred of August left to catch-up.
Help us improve this data.
If you have data on rivers that can be added to our list of 41, please contact David Brown: dbrown@americaoutdoors.org