By: Zeb Smith, Zebulon LLC
Ever worry that an economic disruption (recession, inflation, or otherwise) will negatively impact your outfit? We can’t predict the future, nor the specific effects it’ll have on your outfit. But we can learn from our past to more easily navigate the uncertain waters of today’s “new normal.”
Let’s reflect on three big indices, and how they reacted to three significant disruptions in recent memory. By doing so, we’ll be better prepared to navigate the ups and downs of outdoor recreation business ownership - no matter the economic climate.
The three disruptions we’ll look at in this article are:
-
The 9/11 terrorist attacks of 2001
-
The global economic crisis and housing crash of 2008
-
The Covid-19 pandemic of 2020
The Big Three Economic Indices
There are three factors to consider when discussing economic impacts on outfitters: How much money people earn, how much money people spend, and the rate at which costs fluctuate.
In the world of economics, each of these factors is considered its own economic index: how much money people earn is “Household Disposable Income”; how much money people spend is “Gross Domestic Product”; and the rate at which costs fluctuate is “Consumer Price Index,” which is one way to measure inflation.
To help outfitters plan for the future, and to provide peace of mind when future disruptions happen, we’ll look at how much time it took each index to recover after each of the three recent economic disruptions.
Important note: The graphs displayed below show nationwide United States data from data.oecd.org. This means your regional numbers might have differed, and your specific outfit might have been more adversely impacted during each disruption, especially if you work internationally or serve international customers. We suggest using the following trends as a baseline to understand the broader, national implications of what happened in the past and what may happen in the future.
Household Disposable Income (AKA Take-Home Pay)
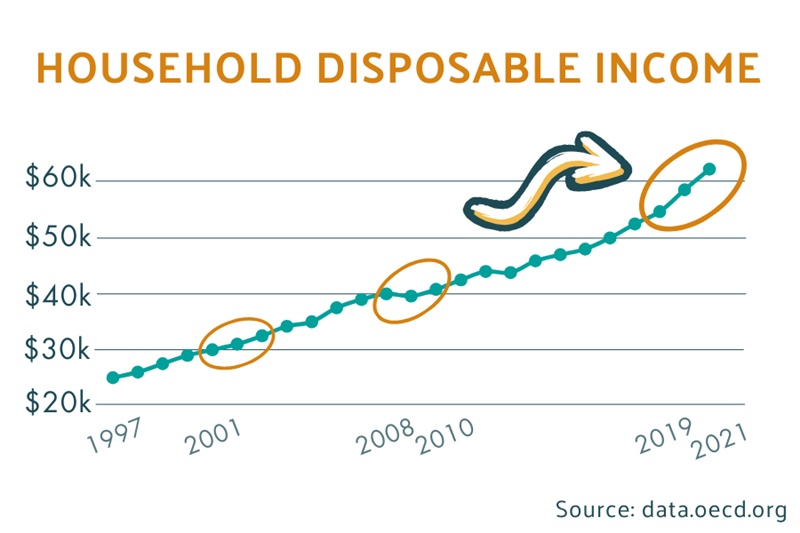
The household disposable income index is, essentially, the average annual take-home pay per person across the nation. Household disposable income is the primary driver behind how much money consumers have in-pocket to spend on goods and services; it’s also how much money an average employee expects to make each year, after taxes and mandatory deductions.

In the above graph, the average person took home $30k/year in 2001. Two decades later, by 2021, that had more than doubled to $62k.
Look closely at how the line moves and dips following each of the three economic disruptions (the circled areas). In 2001’s economic downturn, US household earnings were not impacted. Increases to disposable income kept steadily trucking along year over year, despite the terrorist attacks. In 2008, disposable income dropped a mere 1%, and then rebounded just two years later.
In comparison, in 2020 the average disposable income climbed by an eye-watering 14%, or $8k, per person over two years - the largest jump in recent history. This means consumers had much more money to spend during Covid. When you pair these extra funds with the knowledge that everyone was encouraged to get outside, it’s no wonder outfitter sales were so good surrounding the pandemic! Although this 14% increase was awesome for revenue, it’s important to note it wasn’t exactly awesome for those of us paying wages.
Average Annual Wage Increases
From an alternate view, and since the majority of disposable income comes from wages, let’s look at this through the lens of wages paid to employees from 2001 to 2021.
.png)
At the turn of the millennium, an average employee’s annual wage was $30k/year. For those of us in seasonal outfitting businesses, that means in 2001 a seasonal guide probably made about $9k during a sixteen-week summer season.
Fast-forward to 2021: Average employees expected to make around $62k/year, which works out to about $19k for an average summer’s work.
Note, these numbers are based on reported earnings and, since not everyone reports tips as accurately as the government might think, it’s reasonable to believe this $19k is before tips. Soak that up for a minute. How many of your guides made $19k on their W-2 in 2021? Not many.
You might think these numbers are astronomical. Just know that state transparency laws and free online services like Glassdoor make researching wages incredibly easy. Employees today are more aware of their earning potential than ever before, both in and out of the outdoor industry. Many employees now expect, at a minimum, to hit these “average wage” thresholds.
Unfortunately, based on feedback from the CEO & Owner Connect roundtable discussion at the America Outdoors conference in December 2023, potential employees’ expectations of earning $19k for a summer’s work didn’t pair well with the outdoor industry’s relative inability to pay that amount. This discrepancy is a huge contributor to the retention issues and lackluster commitment from employees that outfit owners nationwide say they are experiencing.
Consumer Spend (AKA Gross Domestic Product)
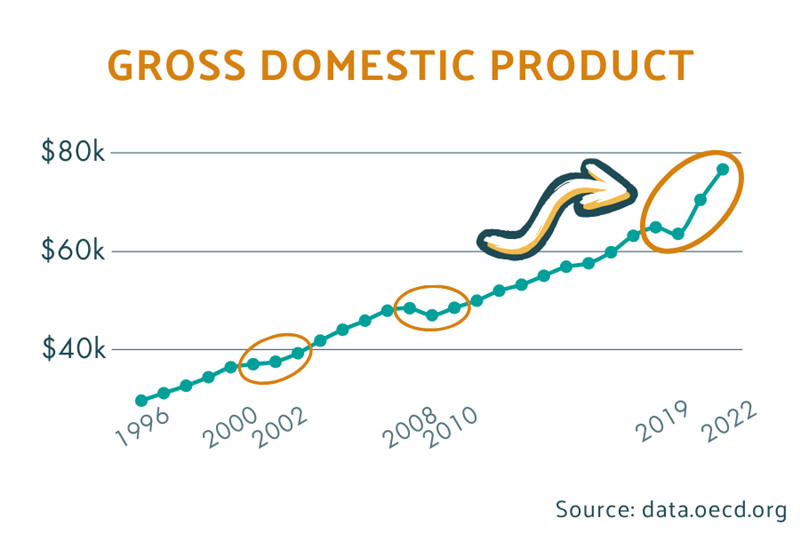
Gross domestic product, in its simplest form, it’s how much consumers spend in a year. Consumer spend directly translates into outfitting revenue.

Let’s look at those three economic disruptions from recent memory again (the orange circles above): Consumer spend slowed - but stayed stable - following 9/11 in 2001. Consumer spend dropped 3% in 2008’s housing crash (remember household income also dropped in this same period - see above), but it recovered in the two years after the crash. Finally, take a gander at 2020: consumer spend dropped just 2% when Covid hit, and then absolutely skyrocketed over the following two years. Holy cow!
Now, having more Household Disposable Income wasn’t the only factor contributing to this hockey-stick climb in consumer spend during Covid. Enter: inflation.
Inflation (AKA Why Does Everything Cost So Much?!)
Simply put, inflation, or the “Consumer Price Index,” is the year over year change in household costs. This includes food, energy, and total spend. The sweet-spot for inflation rates hovers around 2% each year - not too little, and not too much.
.png)
After the September 11th attacks, inflation dropped from 2.9 to 1.6%. Perfect! In 2008, it dropped from 3.8%, the highest it had been in over a decade, to a negative 0.4%. Things actually got less expensive during the housing crisis, which can open up a whole different can of economic worms, but quickly corrected within a year.
Before Covid, inflation was in the sweet spot at 1.8%. Then it took a small dip before skyrocketing to 4.7% in 2021, and then launching into the stratosphere to hit a staggering 8% in 2022. That’s a combined 12.7% in two years. Yowza!
Outfitters are Feeling the Pinch
If you’ve stuck with me this far - you rock. But, hold onto your hats!
Remember above, where we saw that wages jumped 14%, or $8k, in two years? Despite what mainstream media wants us to believe about the impacts of inflation, the end consumer (aka our outfit’s customers and employees) aren’t the main demographic feeling this inflation burn.
Because of the increase in wages, and the increase in all other costs of life, the group hit hardest by these increases are small businesses. Yup - you guys are the ones really feeling the pinch these days.
Predicting the Future
So, how can you take all this textbook-style information and put it to use in your outfit? How will these random graphs help you survive the new normal and whatever economic roller coaster is coming our way?
If you only take away one thing from this article, remember this: History shows that what people earn (AKA Household Disposable Income) and what people spend (AKA Gross Domestic Product) - the two biggest drivers to your domestic revenue - generally recover from economic disruptions after two years.
Once more for those in the back: History shows that the biggest domestic revenue drivers can recover from economic disruptions after only two years.
So, if there’s an economic downturn in the near future: we recommend riding things out for at least two years. After that magic number “two,” things should start returning to normal.
The Outfitter’s Toolkit for 2024 and Beyond
We’ve all heard of “Quantity vs. Quality,” right? Well, let’s step away from the quantitative stuff like charts and indices for a moment, and consider the qualitative stuff.
There are a handful of political, social, and wealth factors - the qualitative stuff - that are key for outfitters to keep in mind as they prepare for their next seasons:
-
There is positive bi-partisan momentum on Capitol Hill with the introduction of the Expanding Public Lands Outdoor Recreation Experiences (EXPLORE) Act in November 2023. This means access to the great outdoors should increase, which would translate to more revenue and bigger seasons for outfitters.
-
It’s “hot” to be outside these days. Nature is the new sexy. Covid really did a number on people’s emotional health, and the super effective marketing touting the health benefits of being outside hasn’t gone anywhere yet. Plus, social media influencers continue to instill “FOMO” when they visit our nation’s most beautiful regions.
-
We’re in the middle of a massive generational wealth shift. Millennials in their 30s and 40s (the next wave of big spenders approaching middle age) are referred to as “the experiences” generation. Many of these folks put off having kids and buying houses, which frees them up to prioritize taking trips, living life to the fullest, and accumulating an arsenal of experiences. Who better to provide those experiences than outfitters?
-
There’s plenty of wealth floating around out there, and people are ready to spend it. According to Betway Insider, the average age to become a millionaire is 37. There are a lot of folks out there with healthy bank accounts seeking experiences!
Where Do We Go From Here?
As we at Zebulon see it, outfitters are primed to do exceptionally well revenue-wise in the foreseeable future. This is regardless of whether or not an economic disruption comes our way. In the here and now, we’ve got positive momentum and support to increase access to the great outdoors, and we’ve got experience-minded consumers with deep pockets ready to make memories.
But, because of the relative economic craziness surrounding Covid (look at the charts above for proof!), and the current $19k summer earning expectations, outfitters just can’t keep running their businesses the traditional way and expect better results than before.
In terms of finances, this means outfitters must be much more intentional with money management. This way, you’ll be able to ride out the two years that history shows us it’ll take to recover from whatever economic disruptions come our way.
It’s time to get laser-focused on your target audience, like freshly-minted millionaires in their thirties, and price your offers accordingly. For tips on how to price your experiences, check out the Good, Bad, and Ugly of outfitter pricing - another Zebulon article for America Outdoors. Doing so will build up cash reserves and free up money to pay more competitive wages, resulting in happier employees and better retention.
About the Author
Zeb Smith, CPA, is a Fractional CFO and Financial Executive for outfitters nationwide - you can reach him at zeb@zebulonllc.com. His company, Zebulon LLC, works closely with outfit owners and managers to strengthen their business’s financial foundations and leadership capacity, helping everyone to work smart, have fun, and make money.